Keeping the track of your windows system and its resource usage is the most important thing to do as an administrator. You must know what causes the extreme load to the server along with keeping the track of resource usage.
There are many factors that may cause extreme load on the system, and windows offer plenty of inbuilt tools to perform the resource monitoring. In this article, we will cover: How to Monitor System Resources on a Windows Server? along with major monitoring tools.
Method 1 – Using Task Manager
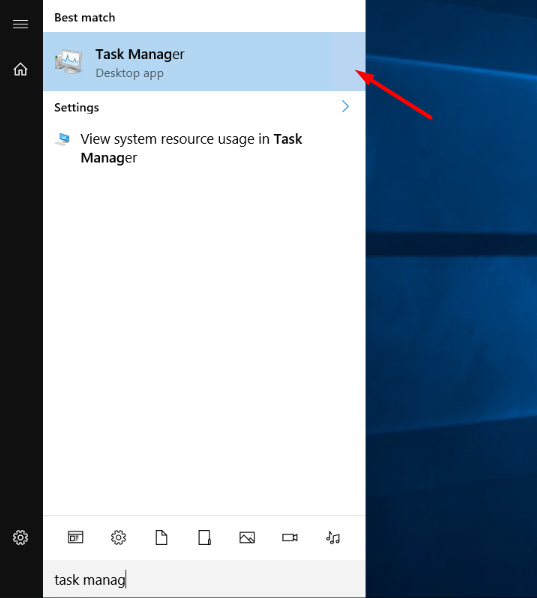
1. Login to Windows, search and open “Task Manager“.
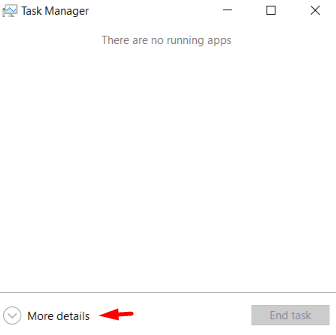
2. Click on, More details.
3. Navigate to Performance. From there you can monitor the usage of various aspects such as CPU, Memory, Ethernet.
CPU: You can check the real-time usage of the CPU using this graph.
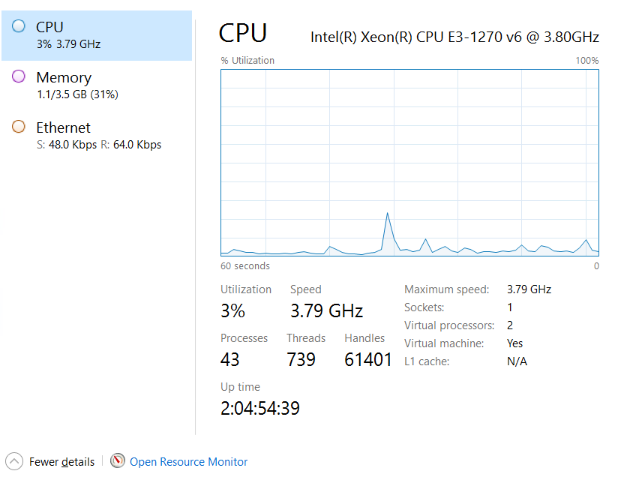
Memory: You can check real-time usage of Memory i.e. RAM using these graphs.
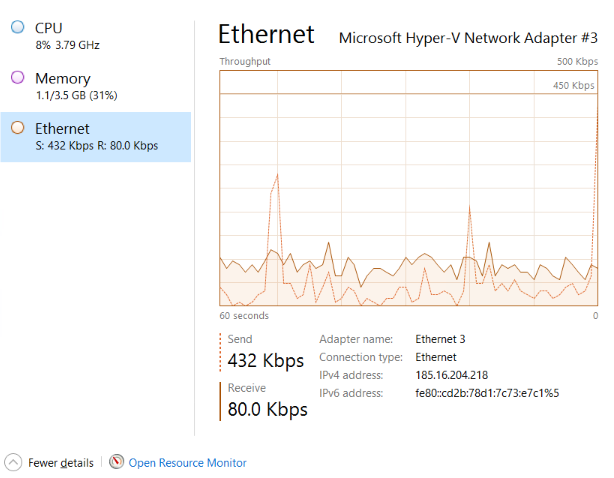
Ethernet: You can monitor the real-time usage of Internet Connection.
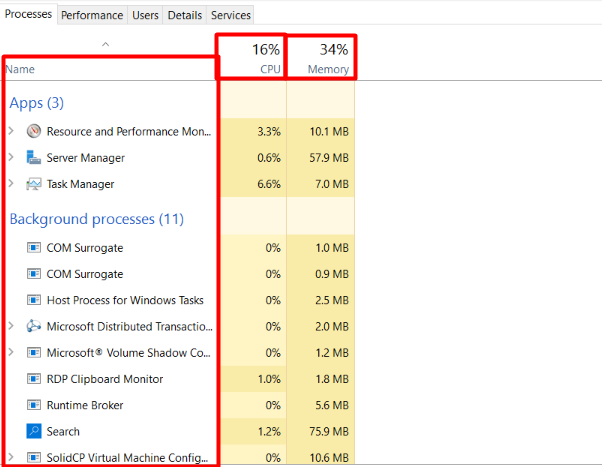
4. More details, you can go through process monitoring from “Processes” tab.
Method 2 – Using Resource Monitor
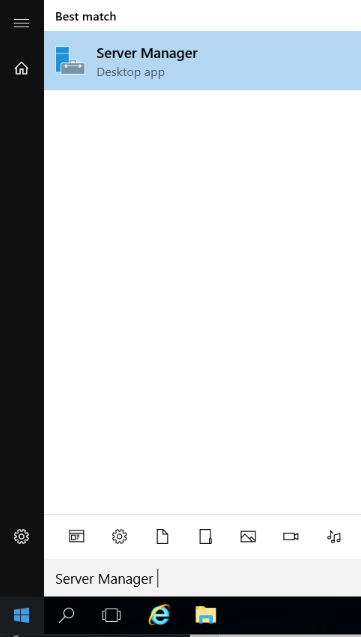
1. Login to Windows, search and open “Server Manager“
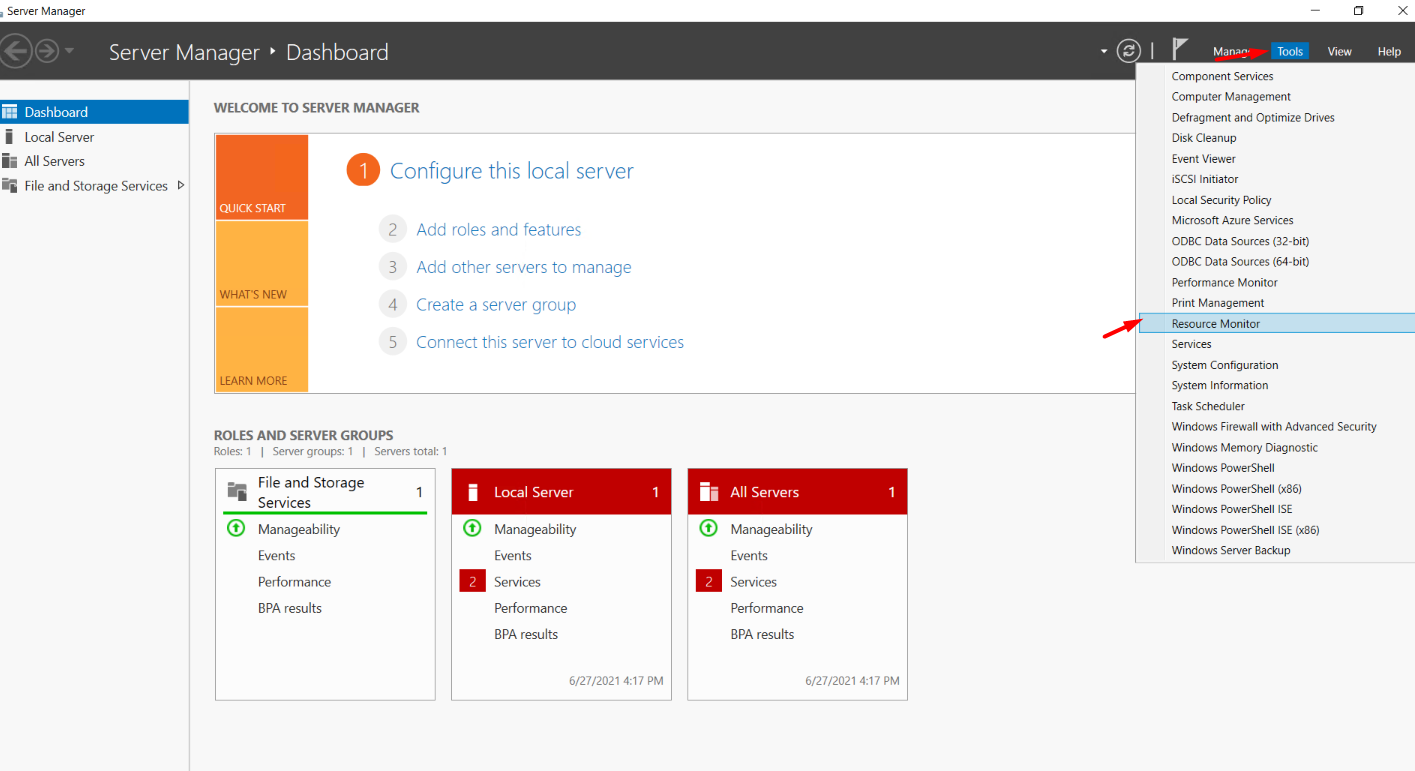
2. Navigate to Tools → Resource Monitor.
3. The same Task Manager, the “Resource Monitor” provides real-time usage of CPU, Memory, Disk, Network.
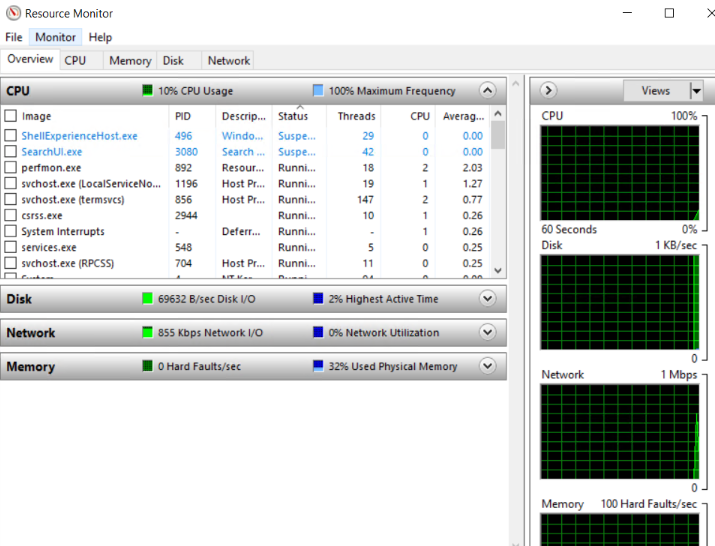
4. In the Overview section, you can check the real-time usage graph of CPU, RAM, Network, Disk IO.
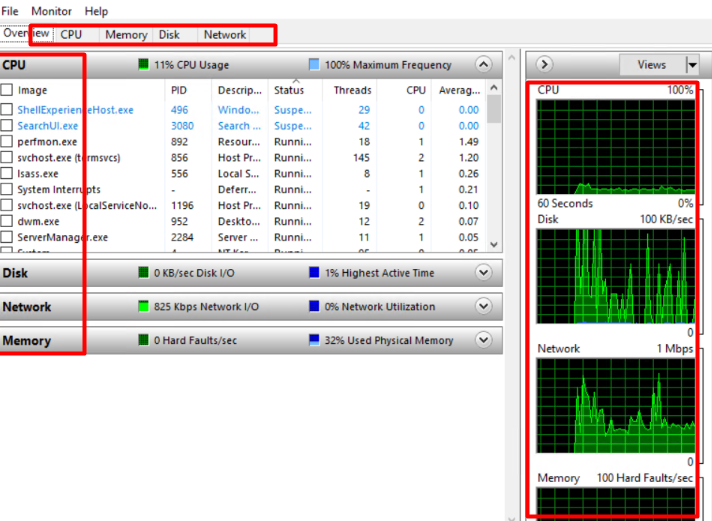
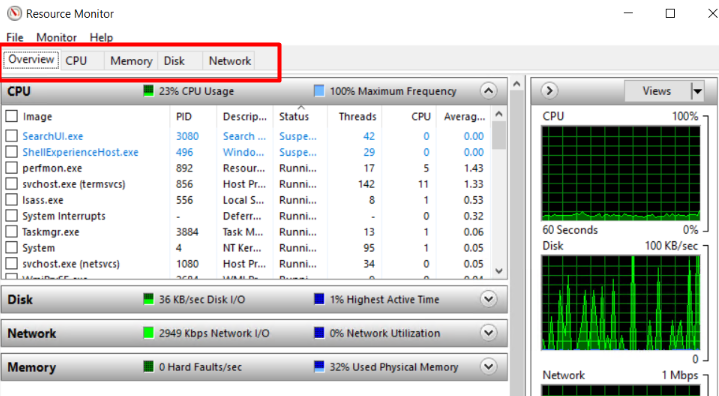
5. To further check the individual resource usage, just click on every single option available at the top,
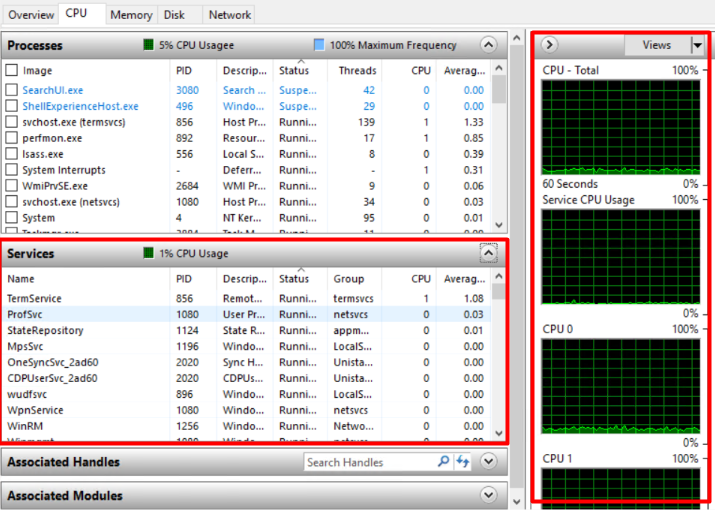
6. If we navigate to “CPU“, you can find all the real-time programs which are consuming a set amount of CPU along with its status, PID and description,
Status: This represents, whether the process is Running, Active or Suspended.
PID: This represents process ID.
Description: You can find a description of the executable file.
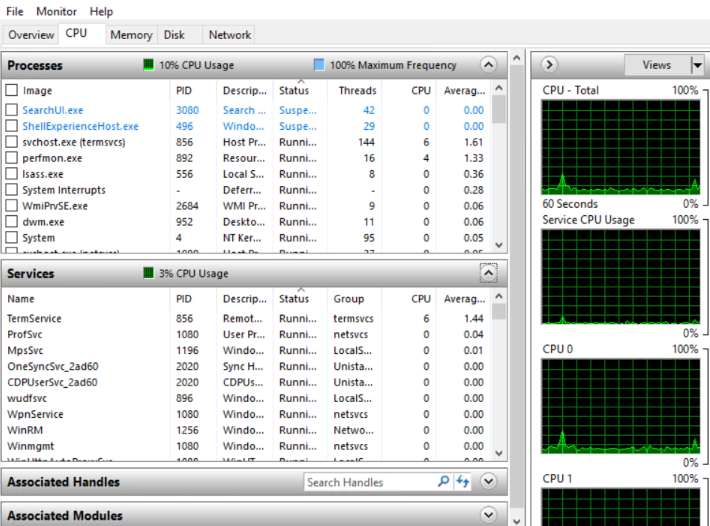
Even, you can monitor all the services name running under CPUs and each CPU usage through graph,
7. In the RAM (Memory) option, you can find all the real-time programs which are consuming a set amount of RAM along with their status, PID, Hard Fault, Commit, Working Set, Shareable, Private.
Status: This represents, whether the process is Running, Active or Suspended.
PID: This represents process ID.
Hard Fault: Average number of hard page faults per second at the last minute.
Commit: The amount of virtual memory reserved by the operating system for the process.
Working Set: Amount of physical memory current use by the process.
Shareable: The amount of memory shared by the process that can be shared by another process.
Private: The amount of memory used by the process that can not be used by another process.
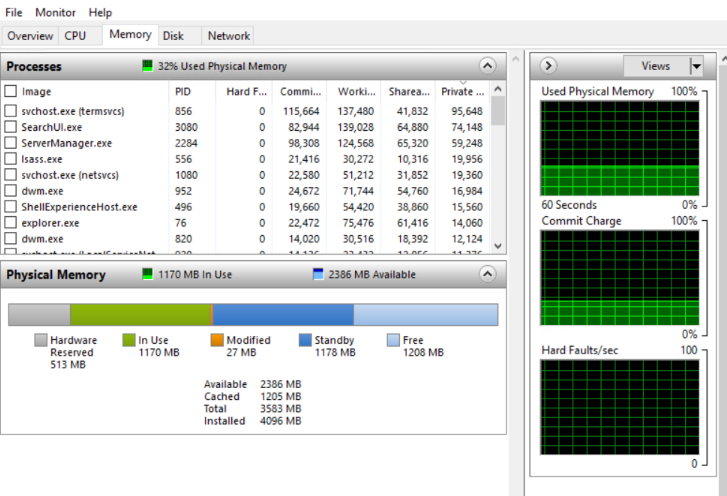
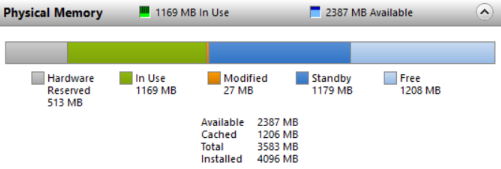
Along with that, you can check the fair use of RAM with Hardware Reserve, In Use, Modified, Standby, Free.
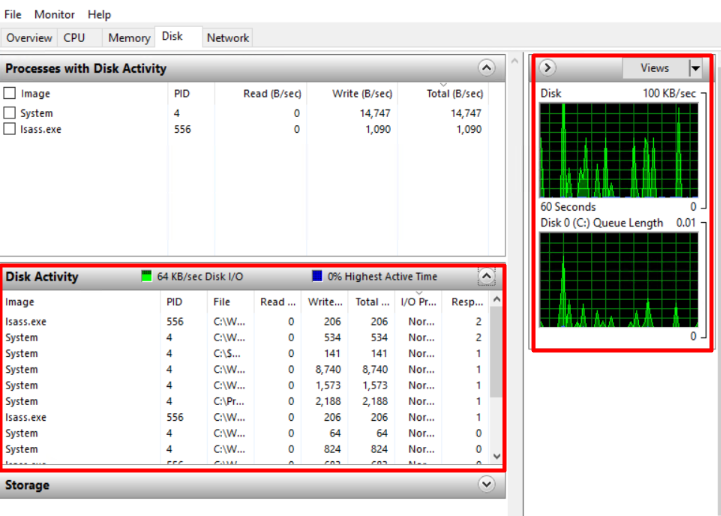
8. In the Disk (Storage) option, you can find all the real-time programs which are consuming a set amount of Storage along with their status, PID, Read, Write, Total.
Status: This represents, whether the process is Running, Active or Suspended.
PID: This represents process ID.
Read: Average number of bytes read by the process at the last minute.
Write: Average number of bytes write by the process at the last minute.
Total: Average number of bytes access per second by the process.
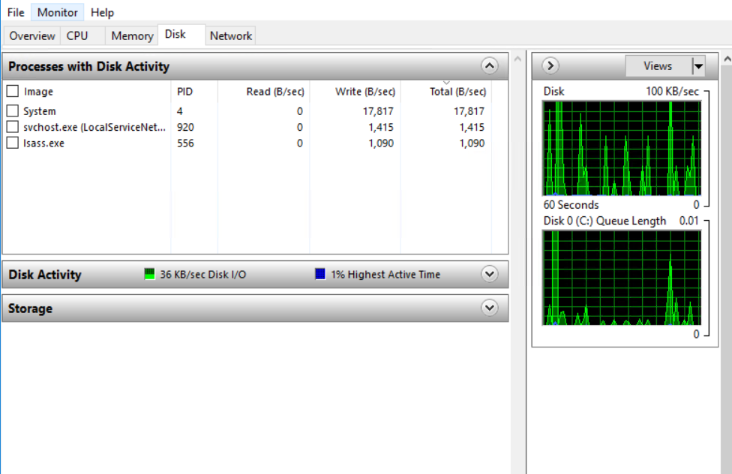
Even, you can monitor the real-time Disk Activity by programs along with Graphs.
9. In the Network option, you can find all the real-time programs which are consuming a set amount of Network along with their name, PID, Send, Receive, Total.
Name: The application name.
PID: This represents process ID.
Send: The number of bytes the process send at the last minute.
Receive: The number of bytes the process received at the last minute.
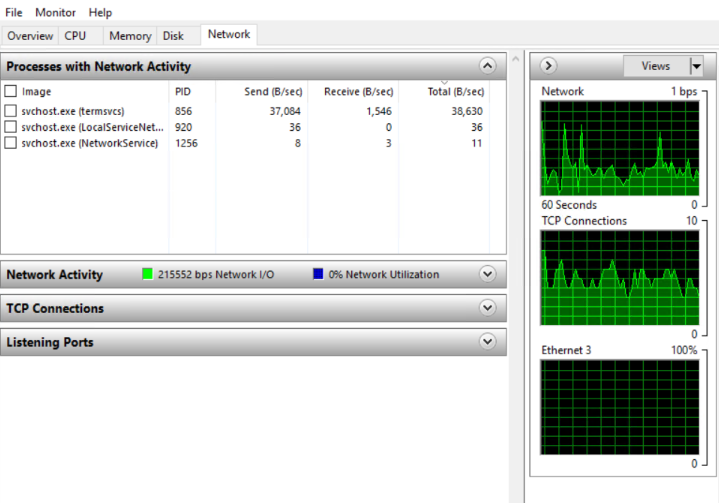
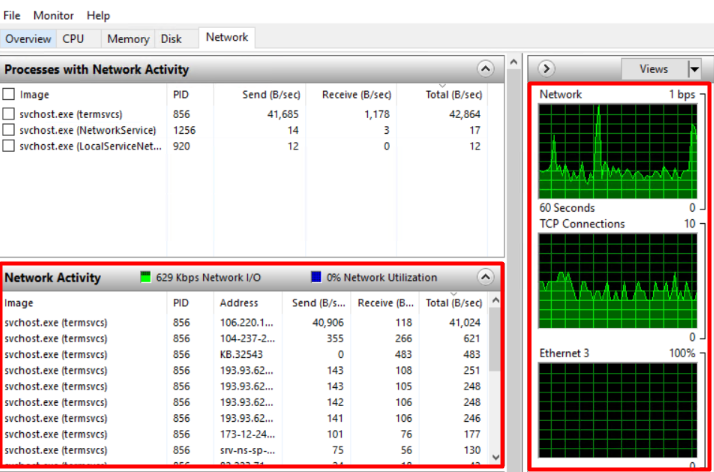
Also, you can monitor the real-time usage of the network with the help of graphs and through the network activity tab.
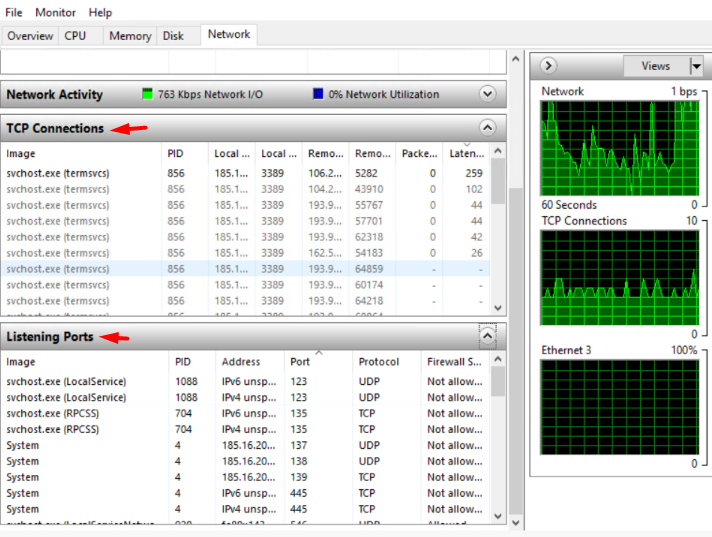
Furthermore you can monitor the TCP Connections and Listening Port activity from the same option.
Method 3 – Using Hyonix Portal
Hyonix also does offer basic monitoring of Server resources from its portal. You can check the basic resource usage: CPU, RAM, Disk.
1. Login to Hyonix Portal using https://my.hyonix.com.
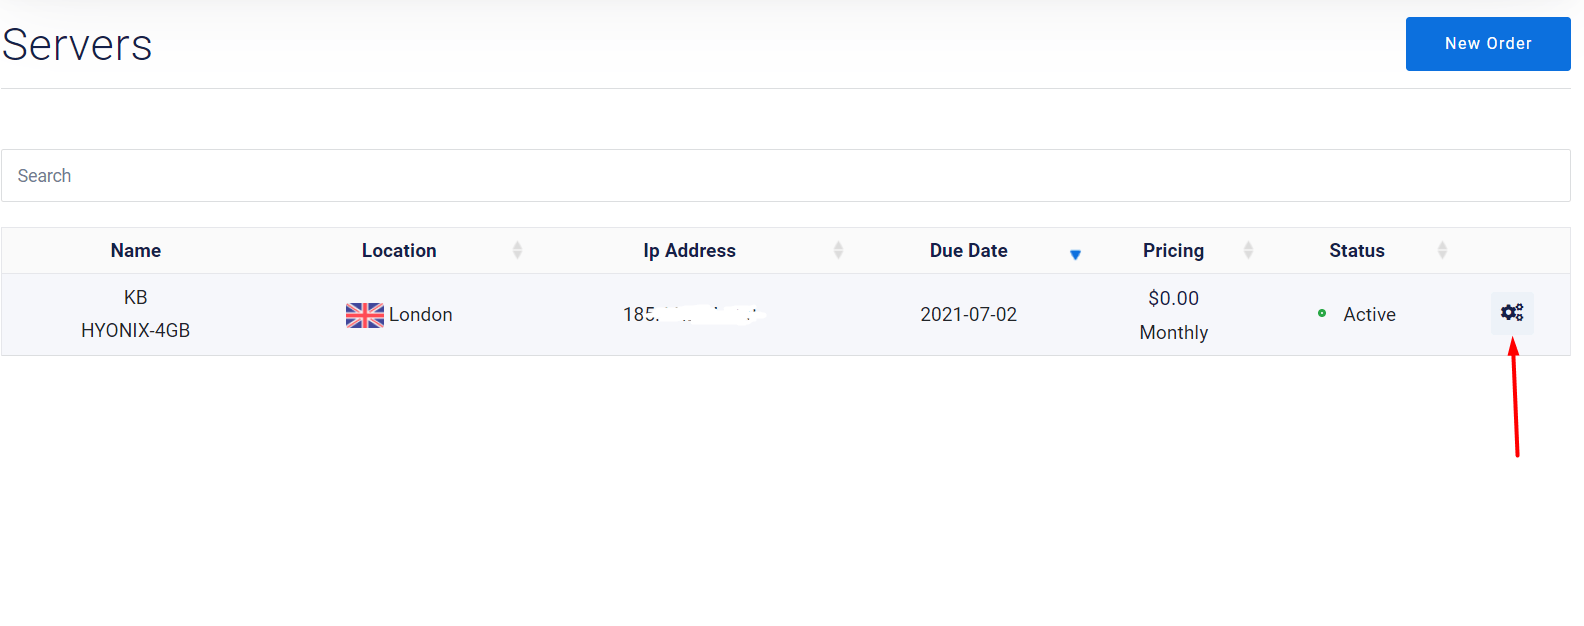
2. Navigate to VPS/Server Control Panel by clicking on “⚙️”.
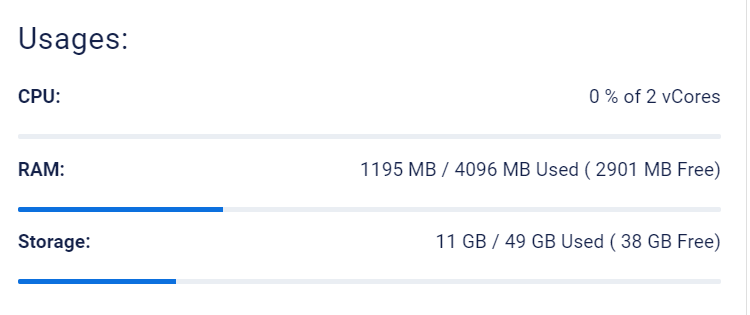
3. In Overview, check the “Usages:” section for real-time resource usage.
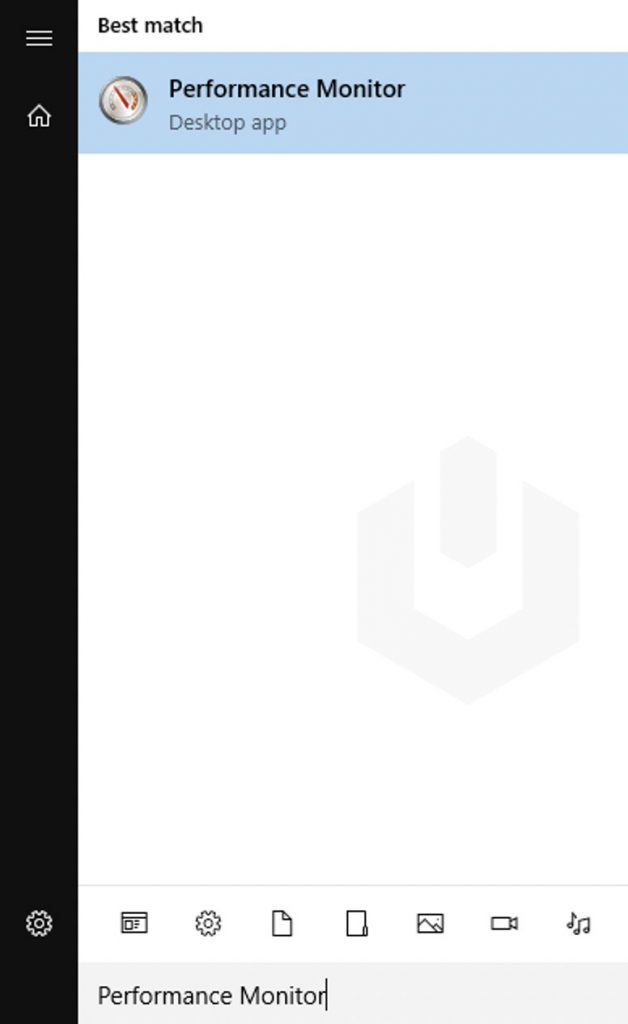
Method 4 – Using Performance Monitor
1. Login to Windows, search and open “Performance Monitor“.
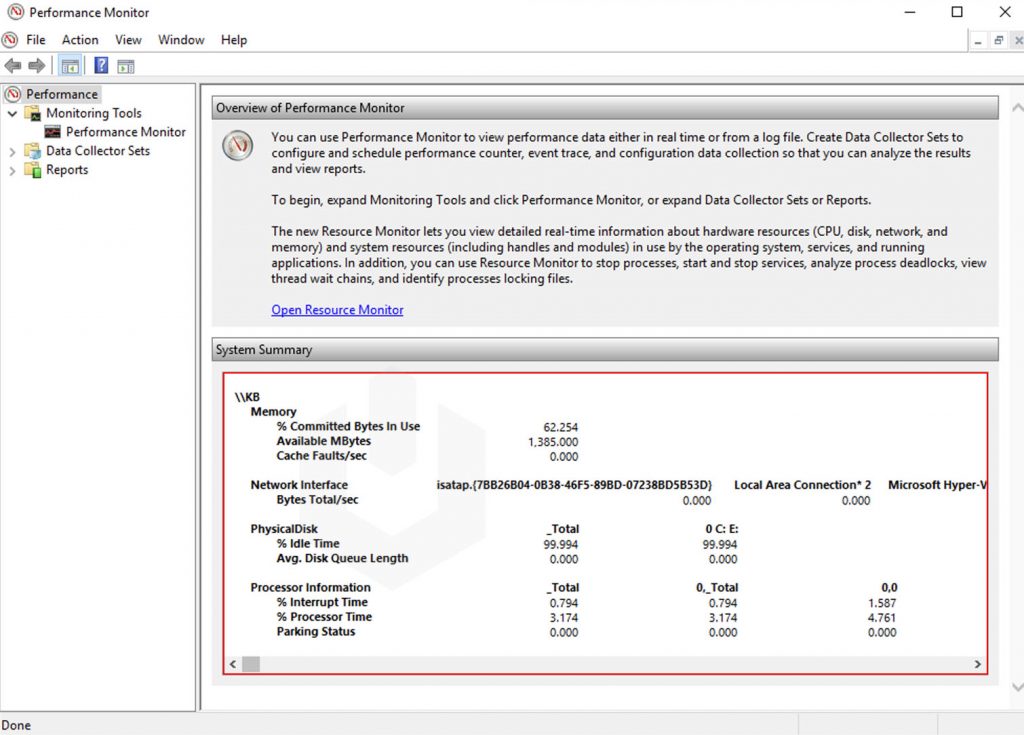
2. Once you open the Performance Monitor tool, you should see the overview of the tool along with real–time statistics of physical memory, disk usage, network adaptor and processor usage.
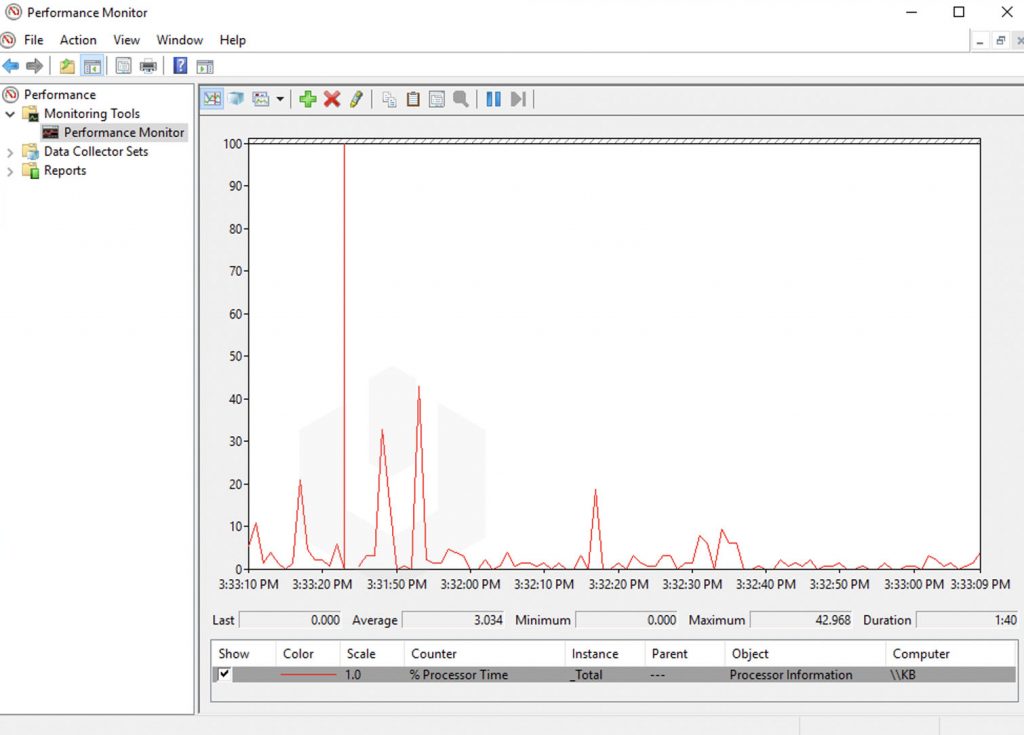
3. Going further through the navigation panel, in the Performance Monitoring, you can monitor the processor time counter, which shows load in the last 100 seconds.
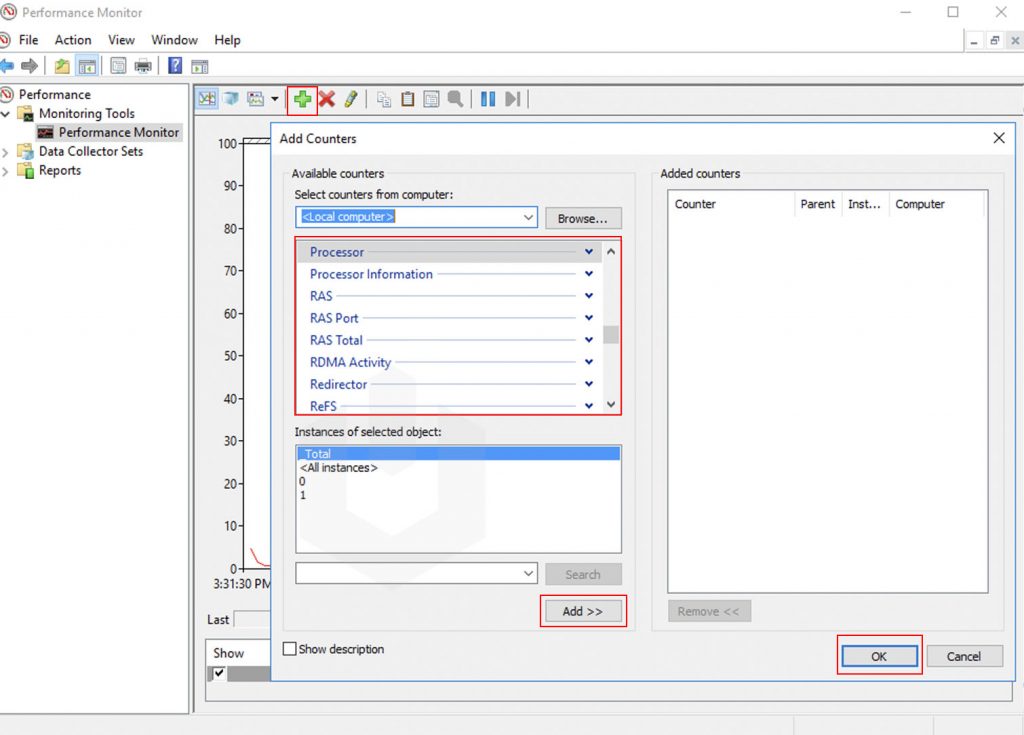
4. On the interface of Performance Monitoring, you can add other variables also and which you can monitor easily using graphs.
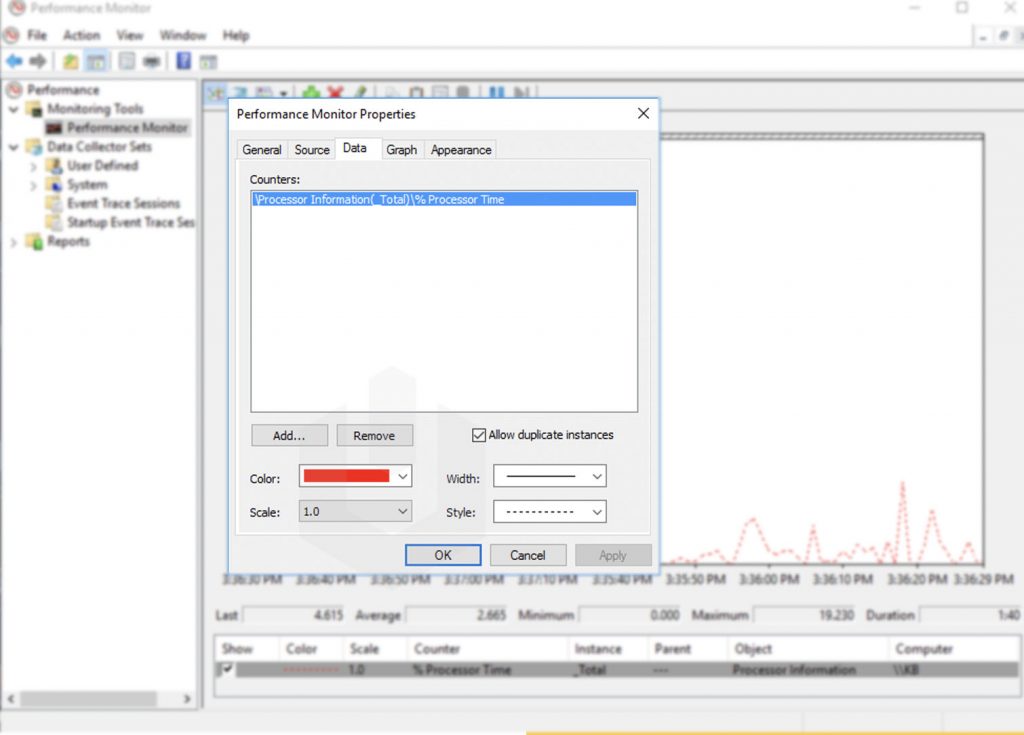
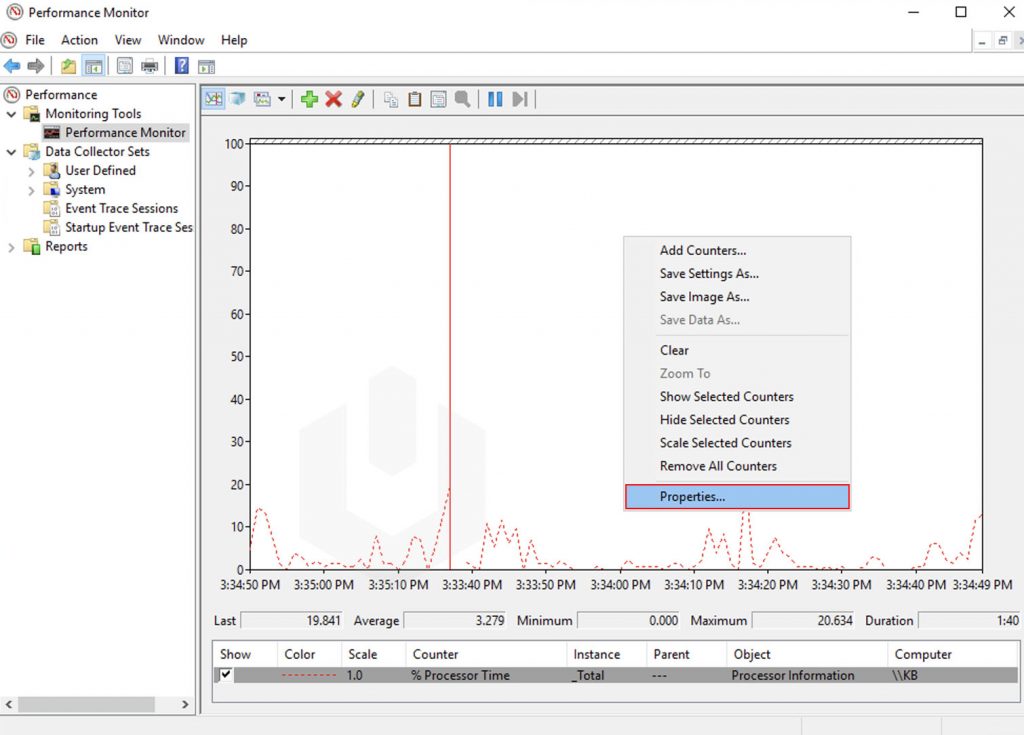
5. To change the setting of graph and visual appearance of monitoring then right-click on the interface → Click on Properties.
6. Using the Properties interface, you can modify the Data, Graph and Apperance of the Performance Monitor output.