In another article, we’ve covered How to Use TRACERT / Traceroute in Windows, the TRACERT command is used to trace the network route and we also covered the important extension available for the TRACERT command.
MTR is a helpful tool used to troubleshoot network problems. MTR is widely used to track issue-related destinations by pulling the real-time data of the packet traveling. Network administrators can analyze the routing and the packets traveling to find the exact problematic destination in the network route. In this guide, we will learn how to perform an MTR test on a Windows / Linux / MacOS.
Installing MTR on Windows
In this section, we’ll be going over how to install MTR on your Windows device.
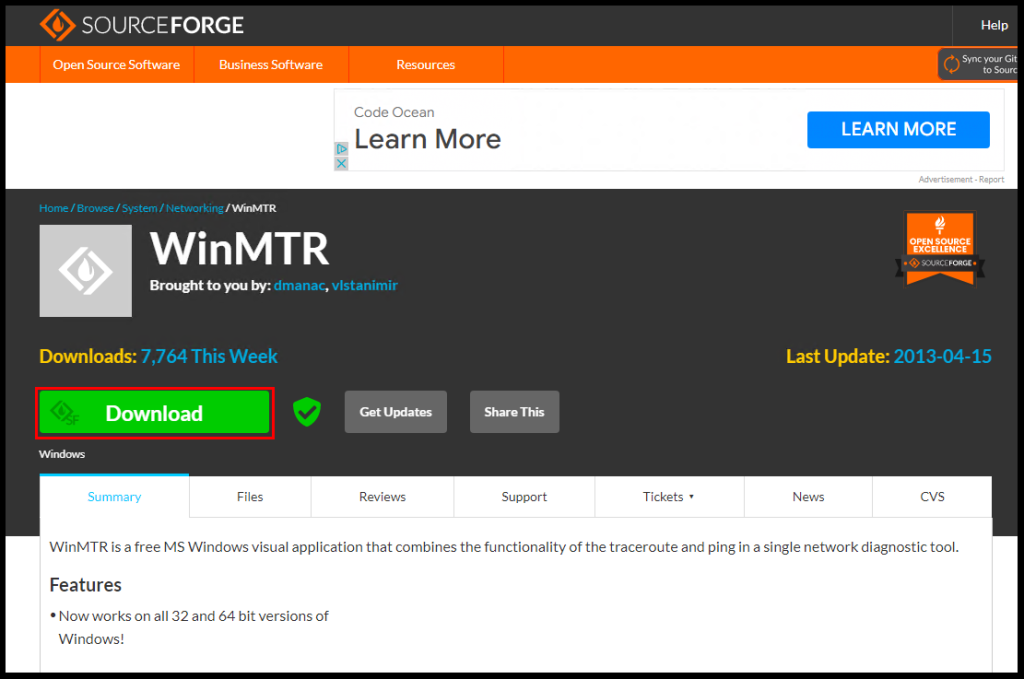
1. To start off, install WinMTR (https://sourceforge.net/projects/winmtr/postdownload) on your Windows device.
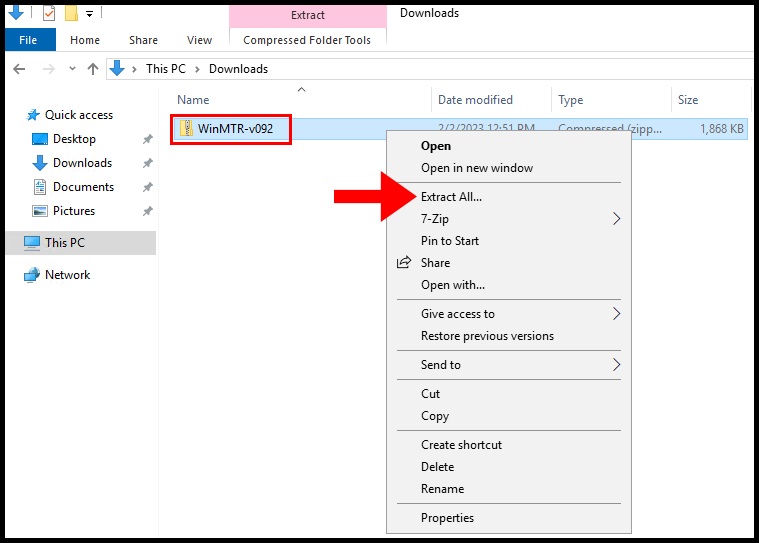
2. Once the download is completed, unzip the downloaded zipped folder.
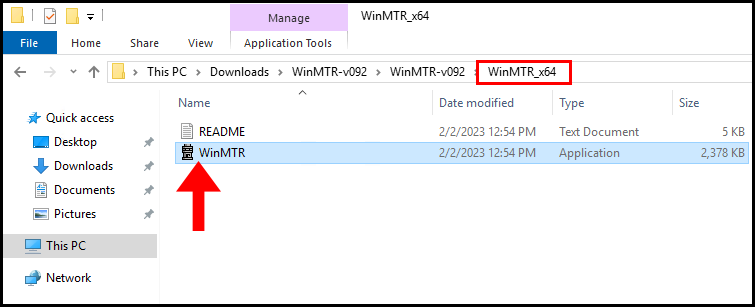
3. Next, we can select between x32 or x64 depending on your CPU. In this guide, we will be using the x64 version. You can then open the WinMTR application.
Installing MTR on macOS
In this section, we’ll be going over how to install MTR on your macOS device.
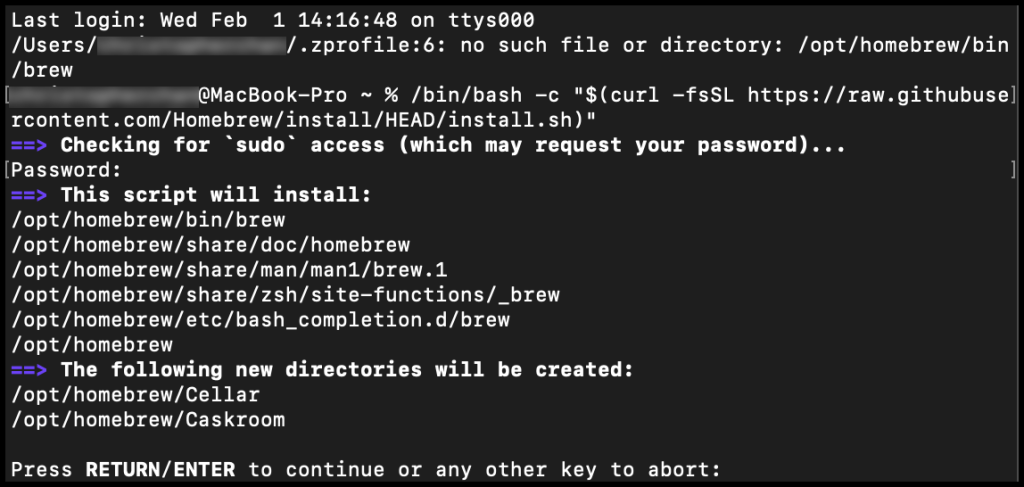
1. To start off, install homebrew on your macOS device by opening a terminal window and running the following command:
/bin/bash -c "$(curl -fsSL https://raw.githubusercontent.com/Homebrew/install/HEAD/install.sh)"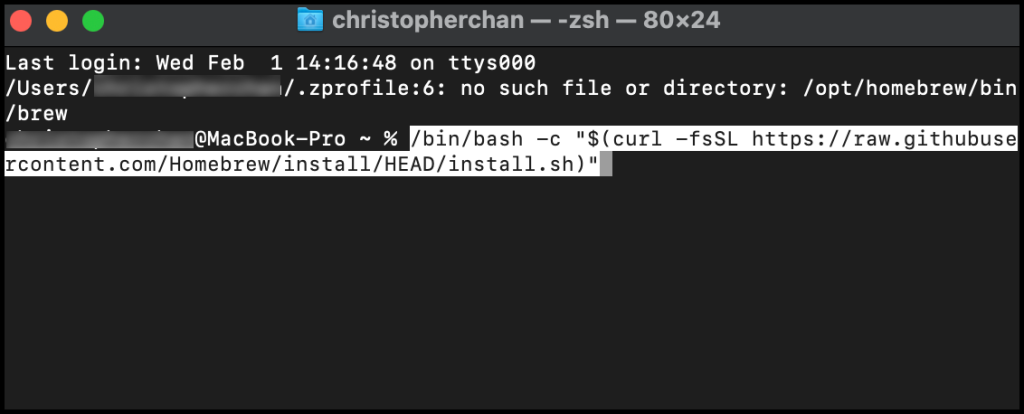
2. The Terminal will then prompt you to click the ENTER or RETURN key, and click the ENTER key on your device’s keyboard.
3. Once the Homebrew installation is complete, you will be prompted to run the following three commands.
echo '# Set PATH, MANPATH, etc., for Homebrew.' >> /Users/YOURNAMEHERE/.zprofile
echo 'eval "$(/opt/homebrew/bin/brew shellenv)"' >> /Users/YOURNAMEHERE/.zprofile
eval "$(/opt/homebrew/bin/brew shellenv)"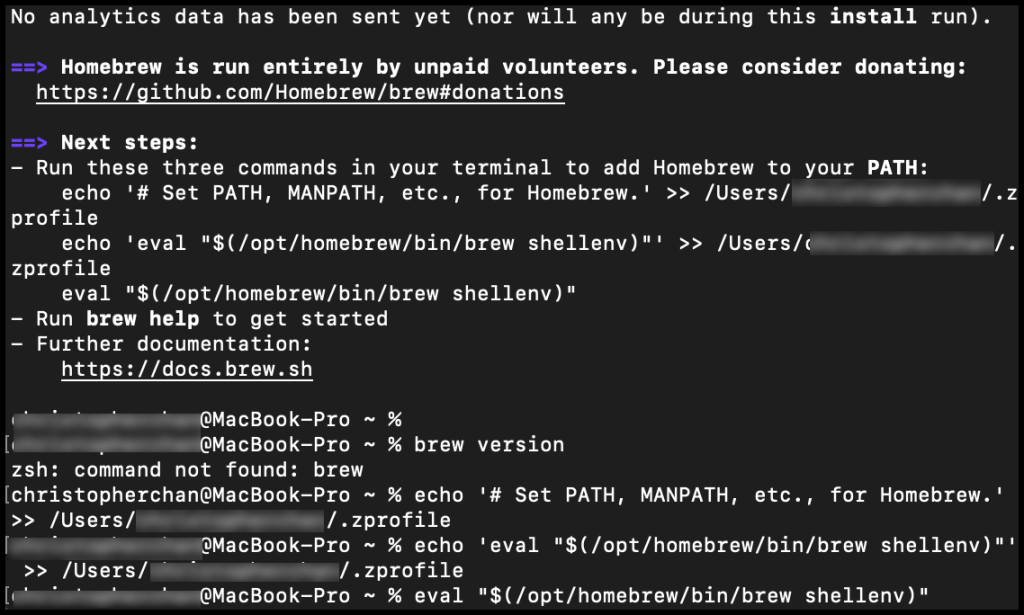
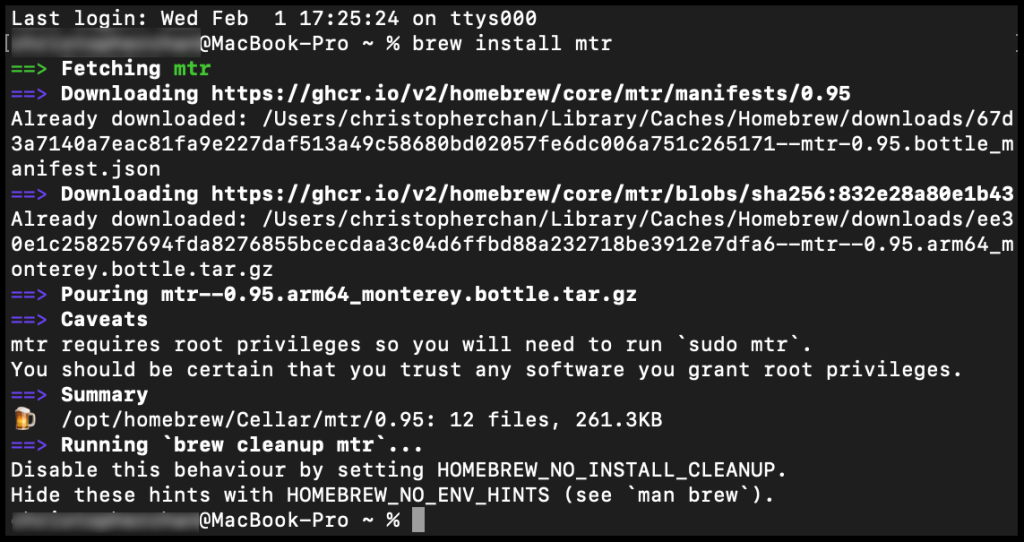
4. Next, run the below command in terminal to install mtr,
brew install mtr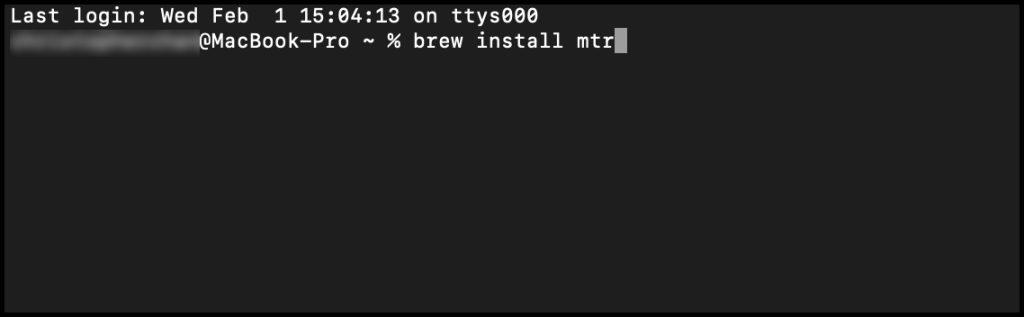
5. You have now successfully installed mtr on your macOS device.
Installing MTR on Linux
Run the following commands to install the MTR on Linux Operating System.
apt-get install mtr --> Debian Linux
yum install mtr --> RedHat LinuxHow to use MTR Tool?
Using the above links and resources, you can download or install the MTR Tool as per your platform. Let’s see how to use MTR Tool for Linux/MacOS/Windows.
How to use MTR Test Tool on Linux?
1. Login to SSH/Terminal as root.
2. Run the following command,
mtr -r <IP-ADDRESS>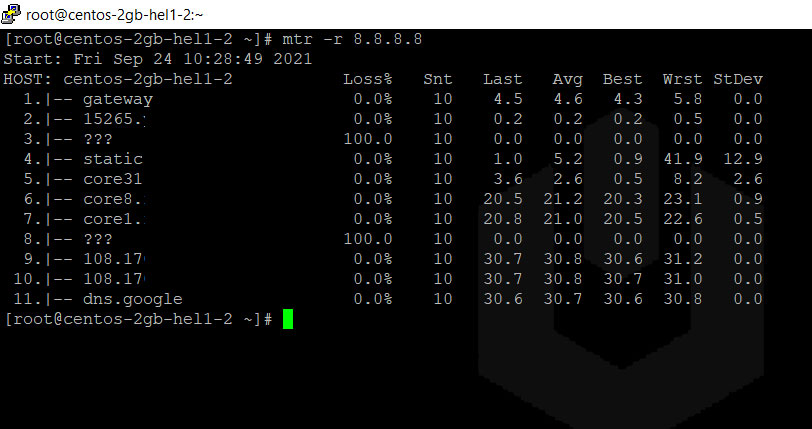
How to use MTR Test Tool on Windows?
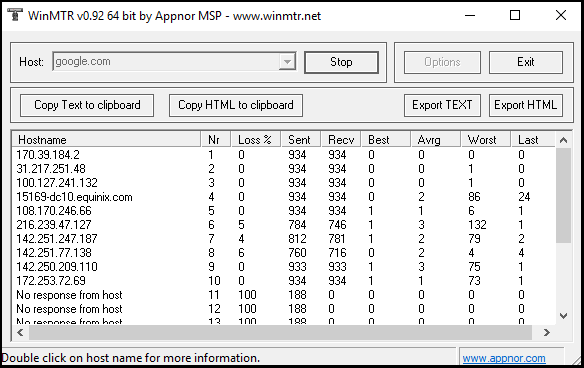
1. Enter a server hostname, IP, or domain in the Host field and click Start to run a trace.
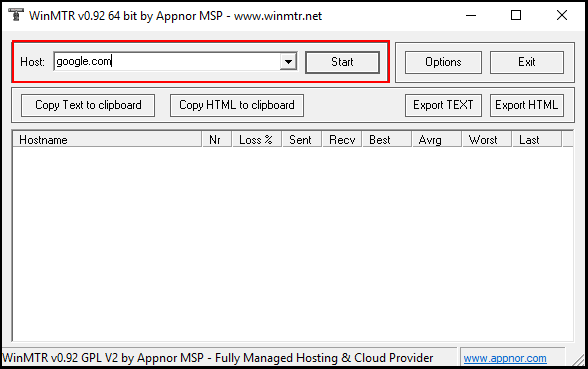
2. The results will begin to appear on the bottom of the page, let it run for at least 5 minutes before stopping it.
How to use MTR Test Tool on macOS?
1. Open Terminal on your local macOS device.
2. Run the following command in the terminal window,
sudo mtr <target IP / Hostname / Domain>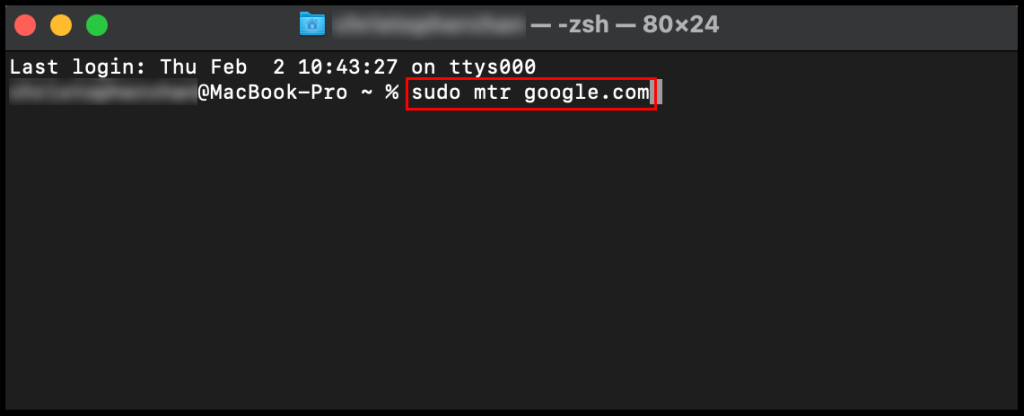
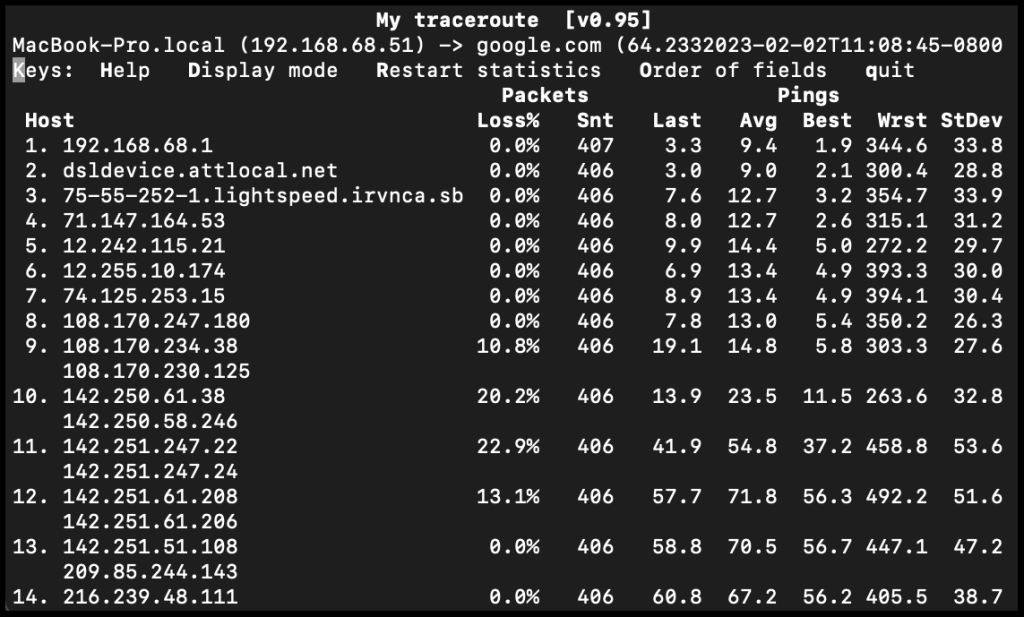
3. You will begin to see the results of the traceroute on your Terminal screen,
How MTR Works?
MTR sends the first ICMP echo packet to the local router and then increments the TTL by reaching the destination router. TTL is a hop counter. Graphical representation of how MTR works is as below,
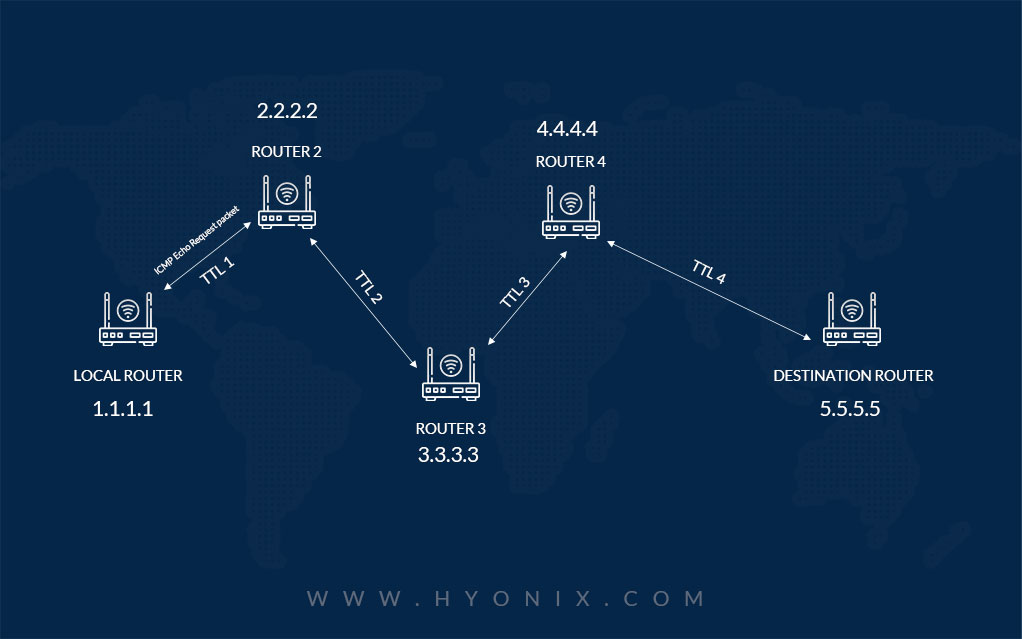
In the above example, from the system, the packet is being sent to the Local Router with the TTL 1; when it reaches the local router, the TTL is decremented by one, and thus TTL is 0, along with the TTL information, the packet shares the router IP address, i.e. 1.1.1.1 in the MTR report (Exact MTR report format you can find below under How to analyze MTR report section). Again, the local router sends the second ICMP echo request packet to Router 2; when the TTL hits the timeout, it will be incremented by 1, so in the report, you can see the TTL 1 along with its router IP address, i.e. 2.2.2.2. The exact process followed for all the network routers till they reached the Destination Router.
How to Analyze MTR Report?
| Host | Loss % | Sent | Recv | Best | Avrg | Wrst | Last |
| cs0-cr.ldn.as9.net (US) | 0 | 13 | 13 | 0 | 0 | 2 | 0 |
| 195.66.224.125 (US) | 0 | 13 | 13 | 0 | 0 | 2 | 0 |
| 74.125.242.115 (US) | 0 | 13 | 13 | 1 | 1 | 3 | 1 |
| 72.14.237.53 (US) | 75 | 4 | 1 | 0 | 3 | 3 | 3 |
| 108.170.237.242 (US) | 40 | 5 | 3 | 0 | 7 | 110 | 7 |
| 108.170.236.121 (US) | 34 | 6 | 4 | 13 | 13 | 15 | 15 |
| No Response from Host | 0 | 13 | 13 | 13 | 13 | 16 | 14 |
| 108.170.252.1 (DE) | 0 | 39 | 38 | 42 | 40 | 24 | 32 |
| 88.198.255.1 (DE) | 0 | 42 | 41 | 41 | 40 | 127 | 28 |
| Destination |
- In the above MTR report, you could see the 5th hop and 9th hop, the worst is greater than the average, and mostly it is considered due to the throughput latency.
- We have no significant packet loss for all the requests except the 7th. In the 7th hop, you could see that the Host didn’t respond to the ICMP echo packets and returned “No Response from Host” in MTR Report. In this case, a network administrator might have configured the router to focus on Transit Traffic instead of entertaining the ICMP echo packets. So, the 7th Host did not entertain the ICMP echo packet and forwarded it to the next router in the network route. Hence, if you can see the Host with the error NO RESPONSE but still it forwarded the packets to the next router, there is nothing wrong with the HOST, which is present in the network route.
- You could see the sudden spike in the hops from 13 millisecondsto 39 milliseconds, 42 milliseconds from 7th hop to 9th hop. The sudden spike in latency is expected because of geological latency differences. In this case 6th, 7th hop host is located in the USA, and the rest two are in Germany. Latency you could see in MTR Difference is standard latency differences between these two geological lands.
- MTR report doesn’t have a continuous latency increase from 1st hop till the last one. If you could see the conditions spike in the latency from 1st hop till the last one or between subsequent hops, then there must have been a problem related to the latency.
Conclusion
In the article, we went through How to perform an MTR test on a Windows / Linux / MacOS. Using this article, you can quickly troubleshoot the latency issue and apparently intercept the affected router in the network route.
Hyonix was founded in early 2018, as we believed the current pricing of Windows VPS was far too overpriced for most consumers. This makes it nonuser and budget-friendly for many people around the world. Our main goal is to change that – providing powerful licensed Windows VPS at a reasonable price so that everyone can grab one without thinking twice about the performance/price that you will get. Get yourself fully optimized Windows VPS starting @ $6.5/mo from Hyonix.com.